
S&P 500 Analysis: Is the Uptrend Losing Momentum?
Over the past two trading sessions, the S&P 500 has recorded a decline of around 1% in the short term, as a new bearish bias begins to take hold in the market. This downward pressure appears to be linked to the recent rise in bond yields, which has reduced the appeal of risk assets such as the SPX index. Additionally, mixed corporate earnings from several companies have contributed to a less optimistic market sentiment. If these factors persist, selling pressure could become more significant in the coming sessions.
Are Bonds Taking the Lead?
Yesterday, the Federal Reserve announced a 0.25% rate cut, setting the new rate at 4.00%. However, what has truly sparked uncertainty in the markets is whether the central bank will maintain this pace of rate cuts in its next meeting on December 10, as policymakers noted that, due to the lack of key economic data, it remains unclear whether another cut will take place.
This shift has led markets to adopt a more hawkish outlook for the Fed, driving a recovery in 10-year Treasury yields, which have climbed above 4%, a level not seen since early October. This increase in yields coincides with a decline in confidence toward the S&P 500 in recent days. In fact, the correlation coefficient between both markets currently stands at -0.67, indicating a moderate negative correlation — as bond yields rise, the S&P 500 tends to fall. It is worth noting, however, that this correlation may fluctuate over time.
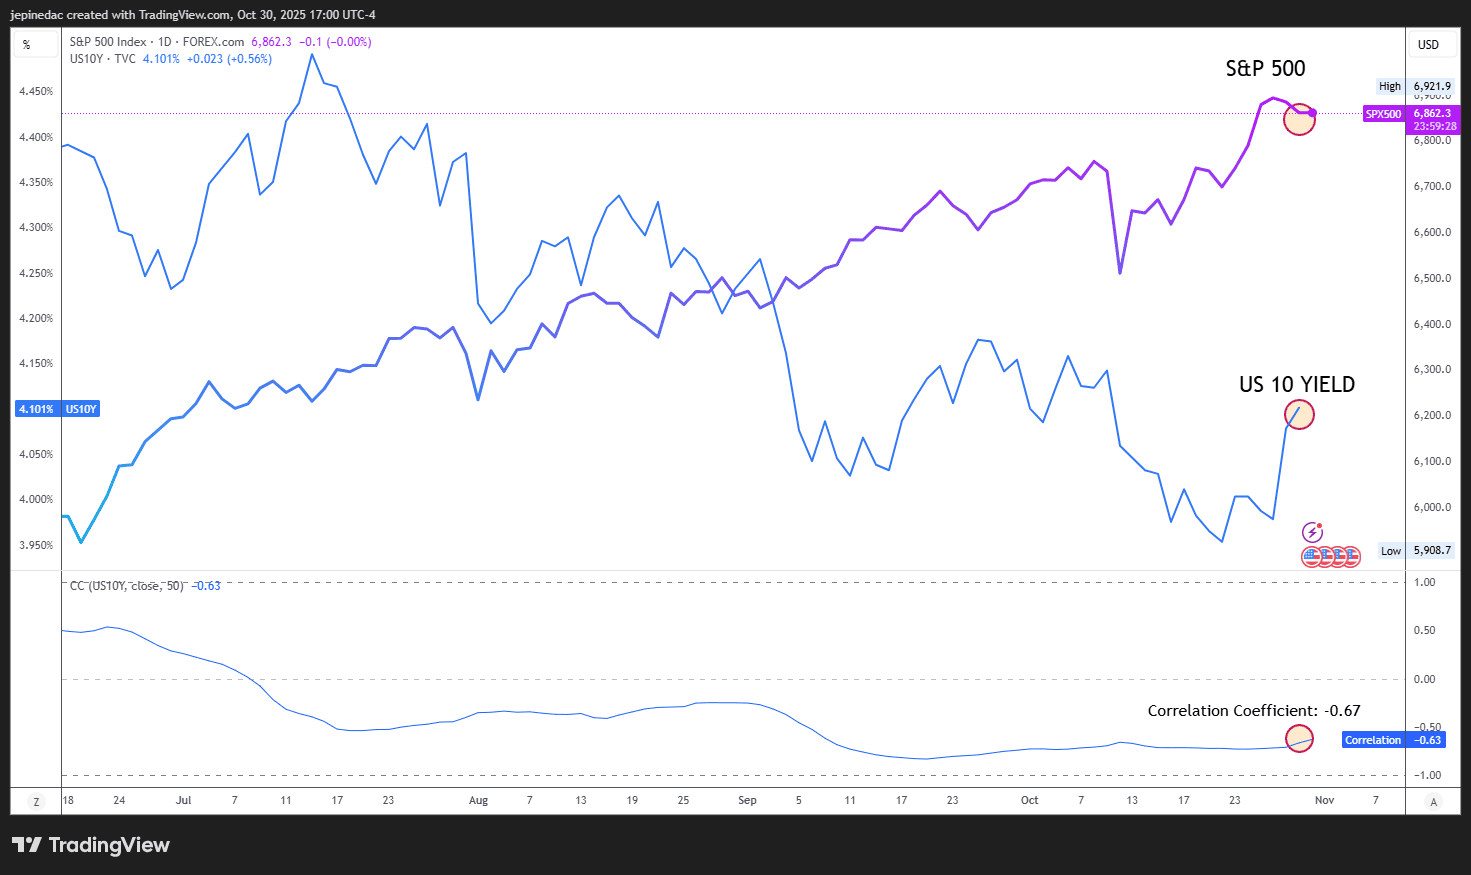
Source: StoneX, TVC, Tradingview
This recent inverse correlation highlights a shift in capital flows, as risk appetite has diminished in response to the Fed’s comments and the rising yields in the bond market, which is seen as a safer investment. Consequently, capital may continue to flow from equities into bonds, potentially weighing on demand for stock indices such as the S&P 500. As long as this inverse relationship persists, selling pressure could remain a relevant factor in SPX movements in the short term.
Long-Term Outlook
Although long-term confidence has shown a slight improvement, the market still lacks a clear directional outlook for the next six months. According to the AAII Investor Sentiment Survey, 44.0% of respondents hold a bullish view, 19.1% are neutral, and 36.9% remain bearish, based on data for the week ending October 29.
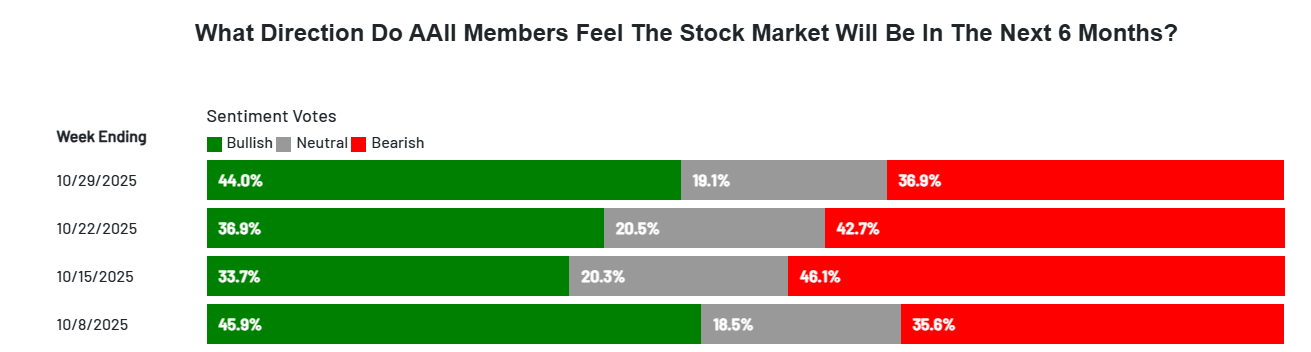
Source: AAII
In this context, as long as investor confidence remains indecisive, there may be no solid structural foundation to support sustained demand for the index in the coming months. Factors such as uncertainty over future Fed decisions and a lack of consistent economic data could undermine expectations of continued growth. If confidence indicators fail to show significant improvement, this could lead to renewed selling pressure on the S&P 500 in the coming weeks as the year draws to a close.
S&P 500 Technical Outlook
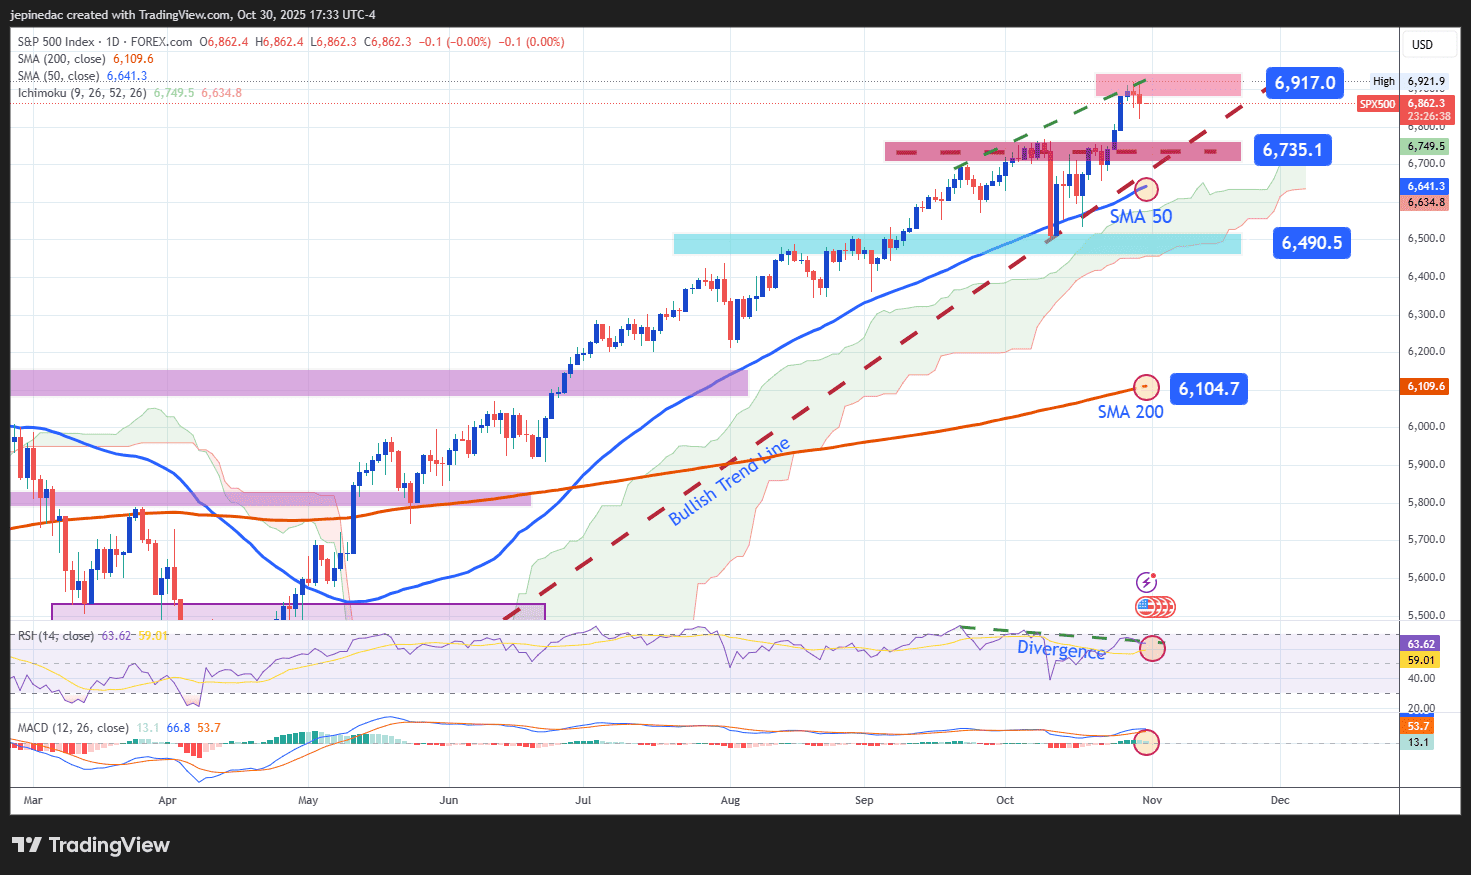
Source: StoneX, Tradingview
- Uptrend Under Review: Recent sessions have been sufficient to maintain a steady uptrend in the S&P 500, which even reached new record highs near 7,000 points in the short term. However, price fluctuations following the Fed’s decision show signs of indecision, which could suggest a potential loss of bullish momentum as the index continues to push toward new highs. If this phase of indecision persists, the current upward trendline may enter a consolidation phase.
- RSI: The RSI line remains above the 50 level, indicating that buying momentum still dominates the last 14 trading sessions. However, the emergence of higher highs in price alongside lower highs in the RSI points to a bearish divergence, suggesting that selling corrections could develop in the short term.
- MACD: The MACD histogram continues to hover near the zero line, reflecting uncertainty in short-term momentum. If this behavior continues, it could lead to a period of sideways or erratic movements in the sessions ahead.
Key Levels:
- 6,917 points – Major Resistance: This level corresponds to the record highs of the index and represents the most important bullish barrier in the short term. A sustained breakout above this level could open the door to new highs and trigger a more aggressive uptrend.
- 6,735 points – Near-Term Support: This area aligns with a recent retracement zone and serves as the primary support level in the short term. It could act as a potential correction zone in case of moderate pullbacks.
- 6,490 points – Key Support: This level marks the most relevant nearby low, located below the 50-period moving average. A decline toward this area could threaten the current uptrend and signal the beginning of a stronger bearish bias.